
I design systems people actually use.
From national health data platforms to multi-institution government reporting, I design complex, high-stakes systems for real, measured adoption.

Product Design

Information Design

Learning Design
.1.svg)
.2.svg)
.3.svg)
.4.svg)
.5.svg)
Services
- Digital products
- Workflow design
- Design systems
- Dashboards
- Data visualization
- Reporting tools
- Digital courses
- Learning journeys
- Interactive content
How I Work
- Stakeholder interviews
- Workflow mapping
- Product and interface design
- Prototyping and iteration
- Design handover
- Team enablement
Selected Case Studies
Role & scope
Principal Enterprise Systems & Data UX Designer · UNAIDS & NACA · 2023
Architected the full data pipeline — collection, logic, and visualization layers
The challenge
National HIV prevention planning had no reliable, up-to-date view of service coverage across Nigeria — spanning all 36 states plus FCT and 774+ local government areas. Without it, health teams were prioritizing interventions and allocating resources without a clear picture of where gaps actually existed.
The solution
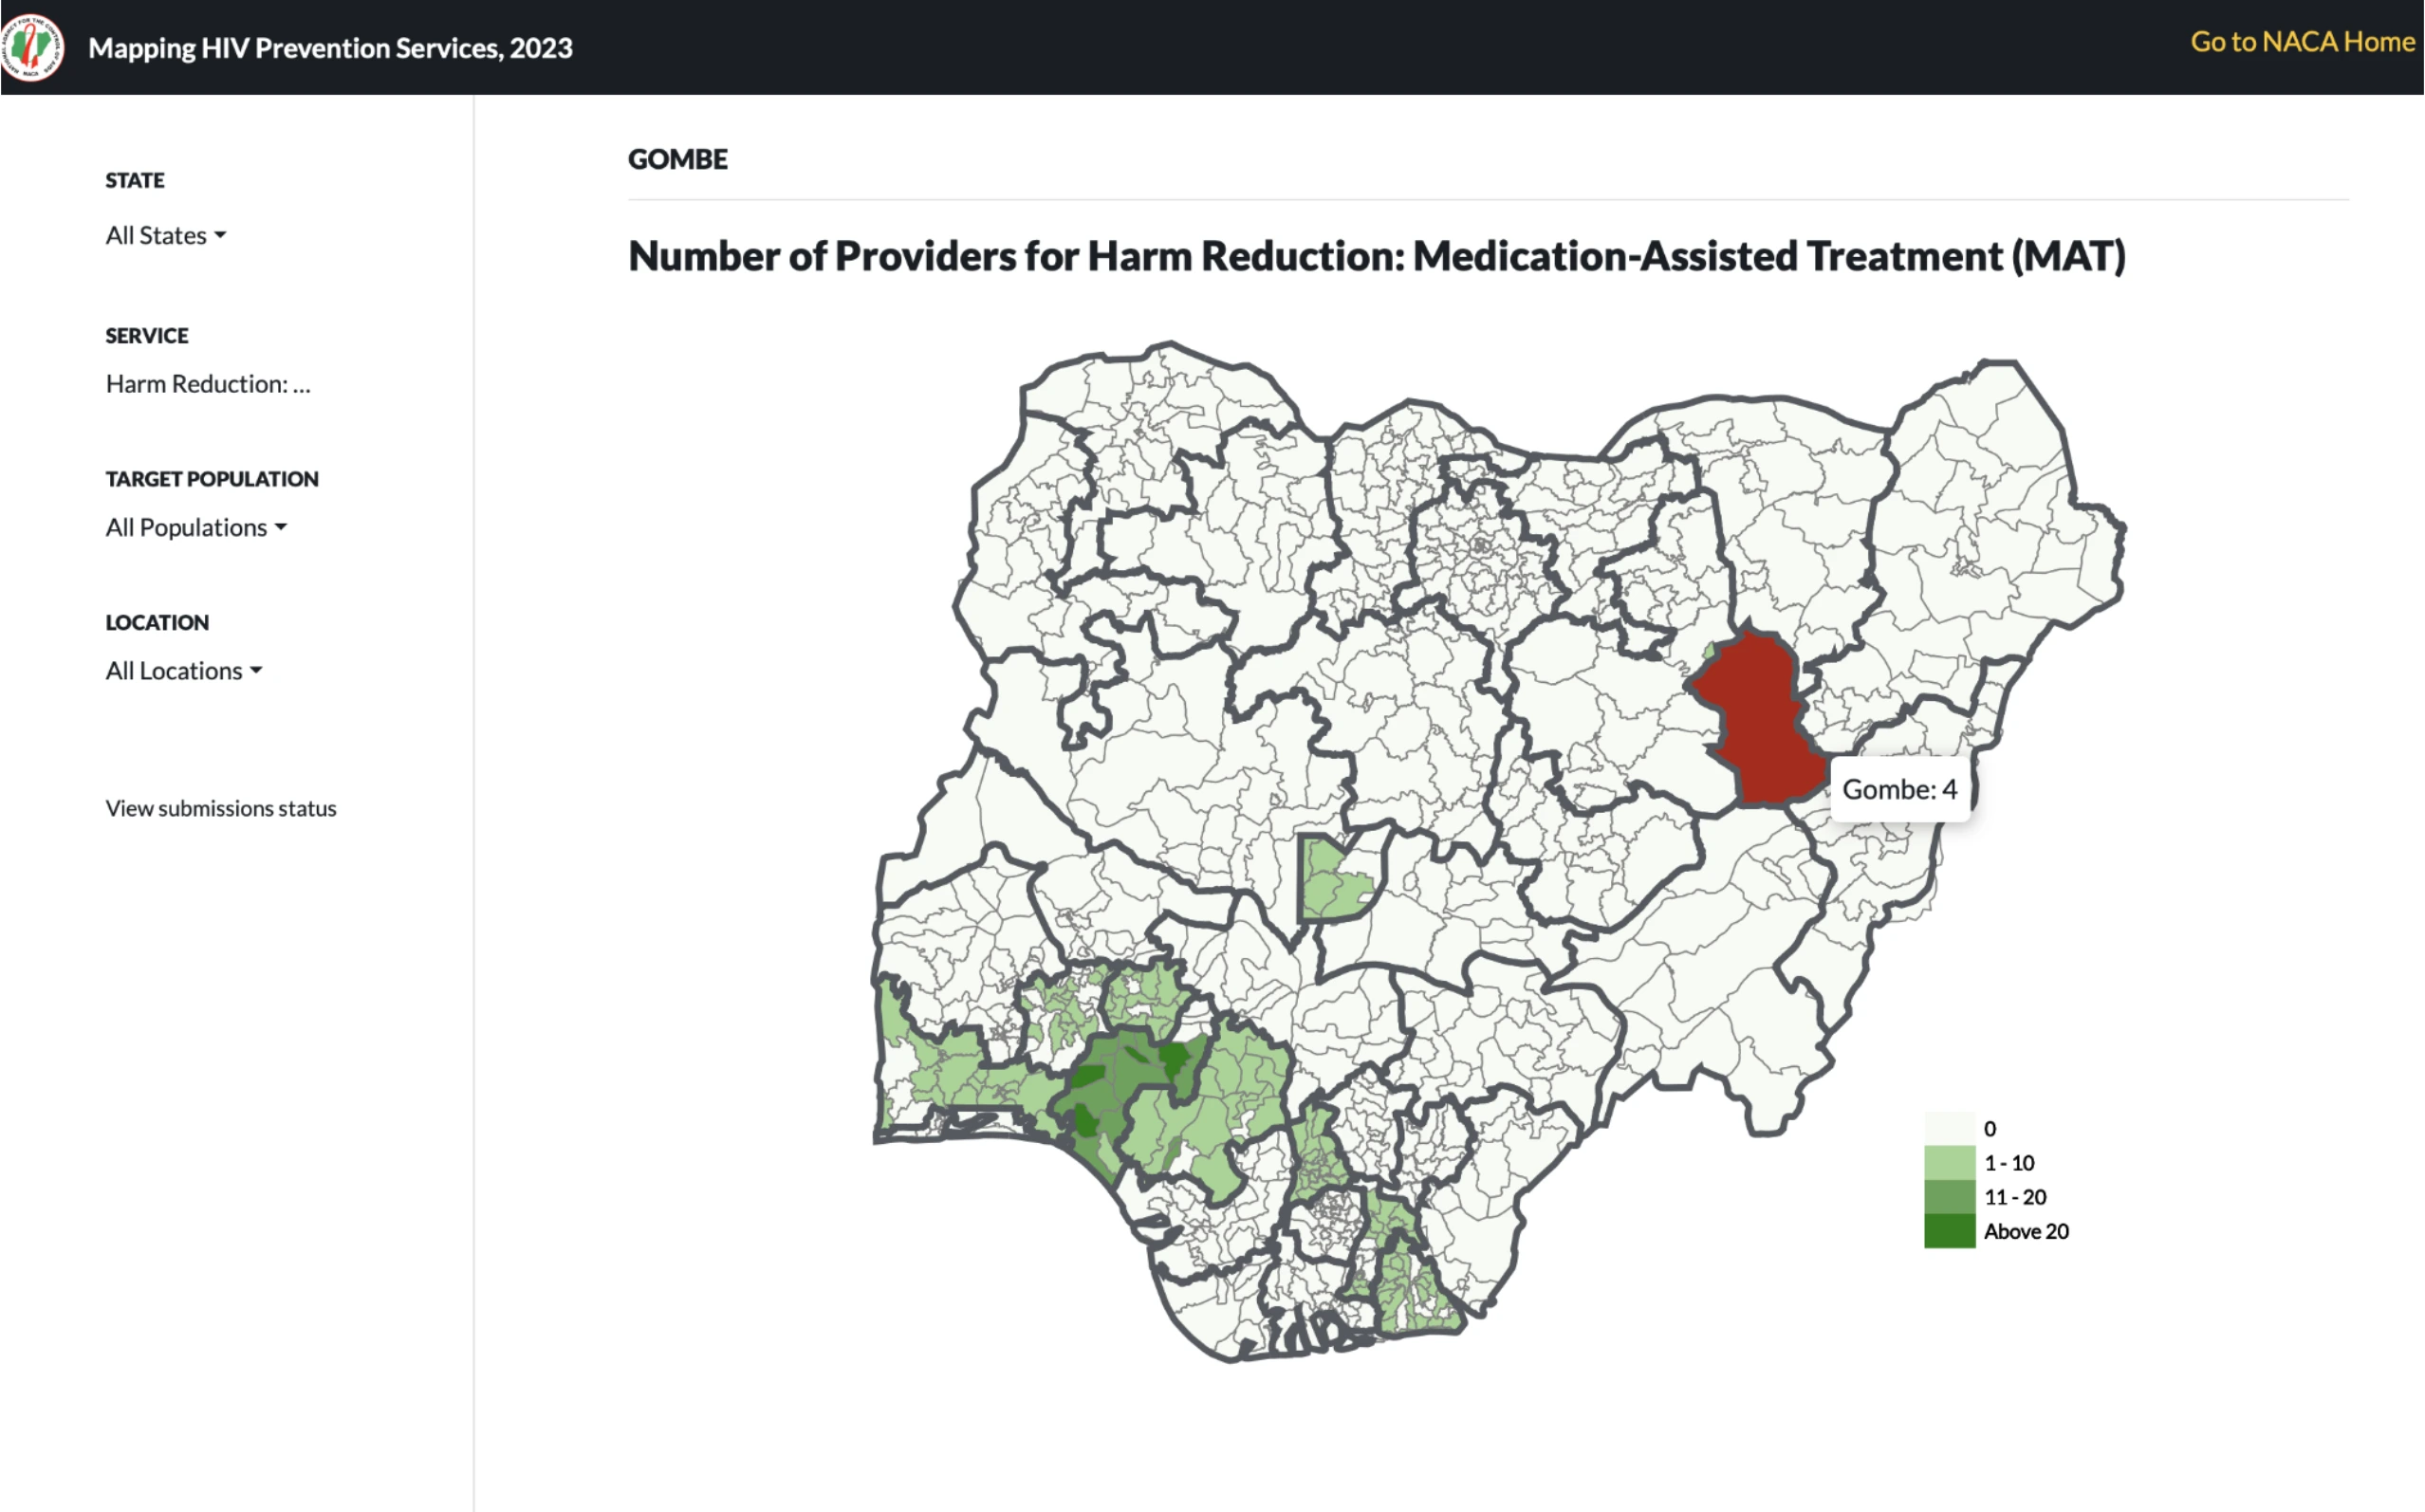
I architected a multi-tier data collection and analytics system: a GIS mapping and dashboard layer built on top of conditional form logic, client-side validation rules, and asynchronous save states — designed specifically to eliminate the data entry fatigue that had undermined coverage data in the past.
The outcome
Forms and accounts were deployed across Nigeria’s 36 states and the Federal Capital Territory. Twelve of the 37 jurisdictions began collecting data within three months, and a working dashboard displayed reported service providers by geographic area.

Role & scope
Learning Experience Designer & Implementation Consultant · UNAIDS × NACA · 2023–2024
Designed and implemented the Moodle learning experience, from curriculum development to administrator training.
The challenge
In-person HIV prevention training required travel, accommodation, facilitators, and venues. Work schedules limited participation, while the program needed a clearer way to assess what participants learned.
The solution
I developed two Moodle courses—Data Visualization for HIV Prevention and Programme Evaluation—with short lessons, multimedia materials, interactive assessments, and progress tracking. I piloted the first course, incorporated learner feedback, and trained staff to administer the platform.
The outcome
The platform launched, and enrolled learners could access both courses. Approximately 20 NACA staff participated in a workshop combining testing and training. Enrollment totals, course completion rates, and long-term adoption were not available for this case study.

Role & scope
Information Architect & UX Content Strategist · GIZ & ECOWAS · 2024–2025. Worked with consolidated reporting information covering 8 ECOWAS institutions; did not work directly with each institution.
The challenge
The consolidated reporting material brought together complex programme information from 8 ECOWAS institutions. The challenge was to organise that material into a clear, coherent annual report that readers could navigate and understand.
The solution
I structured and edited the consolidated information, developed a consistent information hierarchy, and used visual summaries and data visualisation to make key findings easier to locate and interpret.
The outcome
Contributed to 2 annual reports that presented consolidated institutional information in a more accessible, consistent format.
How we can work together
- UX and interface design
- Prototyping and iteration
- Workflow mapping
- Data visualization concepts
- Product and UX support
- Design systems
- Feedback-driven iteration
- Design handover
- UX reviews
- Workflow feedback
- Data visualization guidance
- Learning platform reviews